どこでもドル | 優秀なEAが無料で使える|TRADERS-pro【トレプロ】トレーダーズプロ
どこでもドル
プロフィットファクター
1.4
※バックテスト参考値
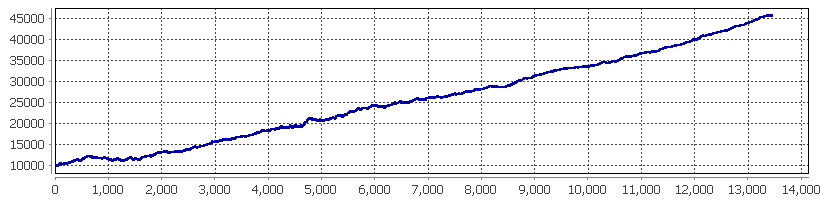
Strategy Tester Report
Dokodemo
XMTrading-Real 12 (Build 1090)
| Symbol | USDJPY (US Dollar vs Japanise Yen) | ||||
| Period | 5 Minutes (M5) 2007.07.09 00:00 - 2018.07.27 23:55 (2007.07.07 - 2018.07.29) | ||||
| Model | Every tick (the most precise method based on all available least timeframes) | ||||
| Parameters | MAGIC=20180805; OrderCom="Dokodemo"; Spread=30; Slippage=30; Lot=0.1; MM=false; MMLeverage=10; | ||||
| Bars in test | 819083 | Ticks modelled | 154581259 | Modelling quality | 90.00% |
| Mismatched charts errors | 43 | ||||
| Initial deposit | 10000.00 | Spread | 5 | ||
| Total net profit | 12797.25 | Gross profit | 44551.88 | Gross loss | -31754.63 |
| Profit factor | 1.40 | Expected payoff | 1.41 | ||
| Absolute drawdown | 29.20 | Maximal drawdown | 536.40 (3.88%) | Relative drawdown | 3.88% (536.40) |
| Total trades | 9079 | Short positions (won %) | 4617 (67.90%) | Long positions (won %) | 4462 (68.15%) |
| Profit trades (% of total) | 6176 (68.03%) | Loss trades (% of total) | 2903 (31.97%) | ||
| Largest | profit trade | 112.55 | loss trade | -133.33 | |
| Average | profit trade | 7.21 | loss trade | -10.94 | |
| Maximum | consecutive wins (profit in money) | 29 (119.56) | consecutive losses (loss in money) | 13 (-127.26) | |
| Maximal | consecutive profit (count of wins) | 338.53 (17) | consecutive loss (count of losses) | -280.64 (6) | |
| Average | consecutive wins | 5 | consecutive losses | 2 | |